 Outh
OuthPersonal Injury Claim Value: A Practical Valuation Guide
Learn how personal injury claim value is calculated, what moves the number up or down, and how to read settlement ranges with confidence in 2026.

A personal injury claim can have an average value of $445,408 and a median value of only $48,855. That gap, found in a widely cited dataset covering more than 9,500 personal injury cases, shows why the phrase “average settlement” can mislead claimants. A small number of very large outcomes can pull the average upward, while the median better reflects what happened in the middle of the group. The underlying settlement analysis illustrates the central valuation problem: a claim isn't a single guaranteed figure. It's a range of possible outcomes shaped by injury severity, proof, liability, insurance, timing, and negotiation.
The practical question isn't “What's the average personal injury claim worth?” A better question is, “What range of gross and net outcomes does the evidence support, and how likely is each outcome?” This guide treats claim value like a volatile investment estimate, using distributions, confidence bands, deductions, and time-adjusted proceeds instead of one headline number.
Table of Contents
- What Personal Injury Claim Value Actually Means
- The Two Building Blocks of Every Valuation
- What Moves the Multiplier Up or Down
- Reading Settlement Ranges With Confidence Intervals
- Sample Valuation Scenarios by Case Type
- Timing and Net Proceeds After Fees
- Why Bigger Is Not Always Better
What Personal Injury Claim Value Actually Means
Personal injury claim value is an estimate of the compensation a claimant might obtain from a settlement or judgment. It isn't the amount that will automatically be paid, and it isn't necessarily the amount that reaches the claimant's bank account. A useful valuation separates the gross claim value from the net proceeds after attorney fees, case expenses, medical liens, insurance reimbursement claims, and other deductions.
The distinction becomes clear when you compare the mean and median in the large settlement dataset cited above. The mean was $445,408, but the median was $48,855 across more than 9,500 cases. In practical terms, half of the observed cases resolved at or below the median, while unusually large outcomes increased the average. The same analysis also reported that plaintiffs represented by lawyers received much higher compensation than self-represented claimants, which reinforces that representation, injury severity, and case selection can materially affect outcomes. The dataset and its discussion of averages and medians provide a better foundation than a national average alone.
Think in distributions, not promises
An investment analyst wouldn't value a volatile asset by looking only at its average historical price. The analyst would study the distribution, identify comparable assets, account for downside risk, and estimate a range of outcomes. Personal injury valuation requires a similar discipline.
Four inputs sit beneath most valuation methods:
- Economic damages: Documented medical expenses, lost wages, future care, reduced earning capacity, and related financial losses.
- Non-economic damages: Pain, suffering, emotional distress, loss of enjoyment, and the effect of the injury on daily life.
- Liability strength: The quality of evidence showing that another party caused the injury.
- Comparative fault: The claimant's own share of responsibility, where applicable.
A fifth practical constraint is available insurance or defendant assets. A claim may support substantial damages on paper, yet recovery can be limited by the money available to pay it.
Practical rule: Treat every valuation as a confidence range around a set of assumptions. If those assumptions change, the estimated claim value changes too.
Gross value answers, “What might the claim resolve for before deductions?” Net proceeds answer, “What might the claimant keep?” Keeping those questions separate prevents a large settlement headline from creating a falsely optimistic financial plan.
The Two Building Blocks of Every Valuation
Most personal injury valuation begins with two categories of damages. Economic damages are losses that can usually be supported with bills, wage records, invoices, and professional projections. Non-economic damages address the human consequences of the injury, which require a more interpretive estimate.
Economic damages provide the documented base
Economic losses can include:
- Medical treatment: Emergency care, hospital services, physician visits, therapy, medication, surgery, and necessary equipment.
- Lost income: Pay the claimant couldn't earn during recovery.
- Future care: Reasonably expected treatment and support connected to a lasting injury.
- Reduced earning capacity: The effect of permanent restrictions on future work.
- Property damage and related expenses: Where the facts support those losses.
The calculation starts by collecting reliable records and separating accident-related costs from unrelated care. A guide to personal injury settlement calculations describes economic damages and explains how non-economic damages are commonly estimated in relation to them.
Non-economic damages translate harm into money
Pain, suffering, emotional distress, loss of enjoyment, and daily limitations don't arrive with a standard invoice. Lawyers and insurers may use a multiplier method, applying a factor to economic damages, or a per-diem method, assigning a daily amount for the period of pain and recovery. The multiplier generally rises when objective evidence shows greater severity, longer treatment, lasting impairment, and meaningful disruption to ordinary life.
For a simple illustration, assume:
- Medical bills total $18,000.
- Lost wages total $6,000.
- Economic damages therefore equal $24,000.
- A 3x multiplier produces $72,000 in estimated non-economic damages.
- The illustrative gross valuation becomes $96,000.
That isn't a prediction. It's a transparent demonstration of the arithmetic. Jurisdiction-specific rules can also affect the result, including caps on non-economic damages in particular categories of claims and rules concerning payments from other sources. Those issues require legal analysis because they vary by jurisdiction and case type.
The formula looks simple, but the inputs aren't. A medical bill may be disputed, future treatment may be uncertain, or an insurer may argue that a pre-existing condition caused the symptoms. The value comes from the evidence supporting each line, not from multiplying an unsupported total.
What Moves the Multiplier Up or Down
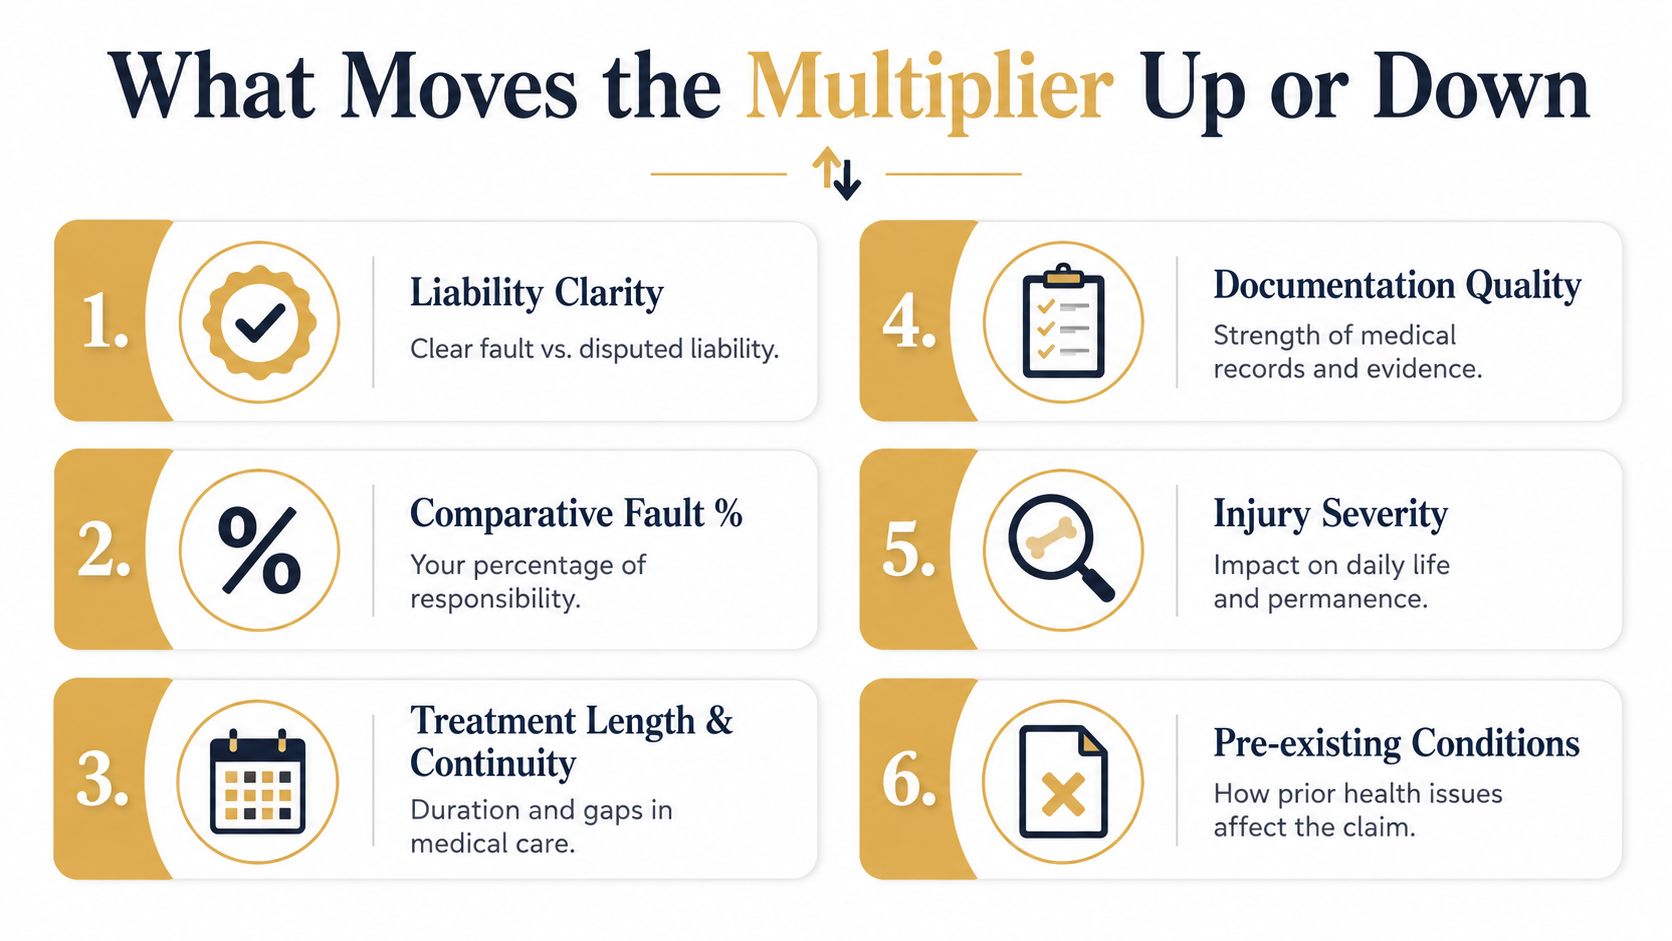
Technical valuation benchmarks commonly place ordinary-case multipliers in a range of roughly 1.5x to 5.0x. Catastrophic injuries, including surgery, traumatic brain injury, or permanent disability, can push the estimate higher. The methodology behind these benchmark factors identifies objective findings, documented impairment, longer treatment, and daily-life disruption as upward pressures, while treatment gaps and shared fault weaken settlement value.
Liability clarity changes bargaining power
A claimant with clear proof of fault starts from a stronger position than a claimant whose evidence leaves room for competing explanations. A documented collision sequence, consistent witness accounts, photographs, video, or an admission can strengthen negotiations. A disputed signal, unclear timeline, or conflicting account creates room for the insurer to discount the case.
Comparative fault works in the opposite direction. If the evidence supports a finding that the claimant shares responsibility, the recoverable amount may be reduced under the applicable law. The effect isn't merely mathematical. Fault disputes can also make an insurer less willing to pay toward the top of a valuation range.
Treatment continuity and documentation matter
Medical records connect the accident to the injury and show how the condition affected the claimant over time. Consistent treatment, clear diagnoses, imaging, specialist opinions, functional restrictions, and an explanation of future care can support a higher multiplier. A gap in treatment can prompt questions about whether the injury remained serious, whether another event caused the symptoms, or whether the claimant recovered.
The direction is more important than a rigid formula. Treatment that continues because doctors document a genuine need can strengthen value, but treatment undertaken without clear medical support won't automatically increase it. Documentation should explain not only what happened in the clinic, but also what the claimant can't do at work, at home, or in ordinary activities.
Severity, permanence, and venue shape the ceiling
A temporary soft-tissue injury usually presents a different valuation profile from a permanent impairment. Surgery, objective imaging, neurological deficits, scarring, cognitive changes, and long-term restrictions can support a materially higher estimate. The question is how the injury changes the claimant's life, not just what diagnostic label appears in the chart.
Venue also affects negotiation. Local juries, applicable damage rules, judicial procedures, and the defendant's policy limits can all influence the upper boundary. A sympathetic venue doesn't guarantee a large recovery, and a high multiplier can't create insurance coverage that isn't available.
The multiplier is therefore best treated as an adjustment tool, not a machine that produces truth. It organizes judgment about evidence, severity, and risk. It shouldn't replace a review of liability, damages, coverage, and procedural constraints.
Reading Settlement Ranges With Confidence Intervals
A confidence range makes uncertainty visible. Instead of reporting one personal injury claim value, an analyst can describe three reference points:
- P10: A conservative lower-case outcome, assuming meaningful weaknesses or downside developments.
- P50: The midpoint of the comparable outcome distribution, with outcomes potentially falling above or below it.
- P90: A favorable upper-case outcome supported by strong evidence, serious harm, favorable liability facts, and suitable coverage.
P50 isn't a promise. It doesn't mean the claimant has a guaranteed chance of receiving that exact amount. It identifies the midpoint of a selected group of comparable outcomes, and the quality of that estimate depends on how well the comparisons match the claim.
Build the band from comparable facts
Historical data can help, but national averages often combine cases that shouldn't be compared. A soft-tissue claim, a documented brain injury, and a wrongful death matter don't belong in the same valuation bucket. The analyst should adjust comparable outcomes for:
- Liability clarity and any comparative fault.
- Injury severity, permanence, and objective findings.
- Treatment duration and continuity.
- Past and projected economic losses.
- Venue and local legal rules.
- Policy limits and other sources of recovery.
- The stage of negotiation and the cost of further litigation.
The Department of Justice figures commonly cited in personal injury discussions reinforce why settlement-focused modeling matters. About 4% to 5% of personal injury cases were cited as reaching trial, while roughly 95% of civil cases settle at some stage. The same source discussion reported that half of plaintiffs received $24,000 or less, the median award across all cases was $31,000, and the median auto-accident award was $16,000. The settlement overview and its cited historical data show why trial verdicts shouldn't be treated as the default outcome.
An estimate should also identify what could move the case from P50 toward P10 or P90. A new medical opinion, a liability document, a treatment gap, an adverse ruling, or newly discovered coverage can change the range.
For a practical way to organize assumptions and compare possible outcomes, use the settlement value calculator. The useful output isn't a single authoritative number. It's a structured view of the evidence, assumptions, uncertainty, and possible net recovery.
Sample Valuation Scenarios by Case Type
The following examples are educational models, not predictions. They show how the same basic formula can produce different results when the injury, evidence, liability, and coverage change.
| Scenario | Key Inputs | Illustrative Gross Range | Valuation Note |
|---|---|---|---|
| Soft-tissue automobile claim | $12,000 in documented medical specials, shorter recovery, possible disputed symptoms | $10,000 to $30,000 | A lower multiplier and any comparative-fault reduction can pull the result toward the bottom. |
| Moderate traumatic brain injury | $80,000 in medical costs, imaging-supported residuals, ongoing treatment | $200,000 to $750,000 | The range is wider because cognitive effects, future care, expert opinions, and venue can materially change value. |
| Clear-liability rear-end collision | Strong treatment records, clear fault, meaningful ongoing impairment | Around $100,000 | A fact-specific estimate may be more useful than a generic auto-claim average. |
Scenario one is driven by proof and recovery
Suppose a claimant has $12,000 in documented medical specials after a soft-tissue automobile injury. A 1.5x starting multiplier would produce $18,000 in non-economic damages before other adjustments, but a valuation still has to account for liability, treatment continuity, comparative fault, and policy constraints. The illustrative gross range of $10,000 to $30,000 is intentionally broad because soft-tissue claims can turn on credibility and documentation.
A treatment record that consistently links symptoms to the collision supports the claim. A long unexplained gap, an earlier similar complaint, or uncertainty about causation can reduce negotiating strength.
Scenario two carries wider uncertainty
Now consider a moderate traumatic brain injury with $80,000 in medical costs, imaging-supported residuals, and ongoing treatment. The illustrative range of $200,000 to $750,000 is broader because the valuation depends on the nature of the residual impairment, expected future care, work impact, expert testimony, liability, venue, and available coverage.
The medical total is only the economic starting point. A claimant with documented cognitive limitations and substantial future earning loss presents a different valuation profile from someone who improves steadily and returns to ordinary work.
For complex injury categories, readers can also review medical malpractice settlement factors, while remembering that the legal rules and evidence differ between malpractice and accident claims.
Scenario three shows why liability can matter
A clear-liability rear-end collision with strong treatment records may support a gross estimate near $100,000 in a particular fact pattern. That number isn't an auto-accident benchmark. It represents the effect of a clean liability story, substantial documented harm, and evidence that connects the injury to the crash.
The exercise is more useful when you challenge every input. Ask whether the economic damages are complete, whether the non-economic estimate reflects actual life disruption, whether fault reduces recovery, and whether policy limits constrain payment. Two people with similar diagnoses can have different claim values because their evidence, treatment history, work losses, and available insurance differ.
Timing and Net Proceeds After Fees
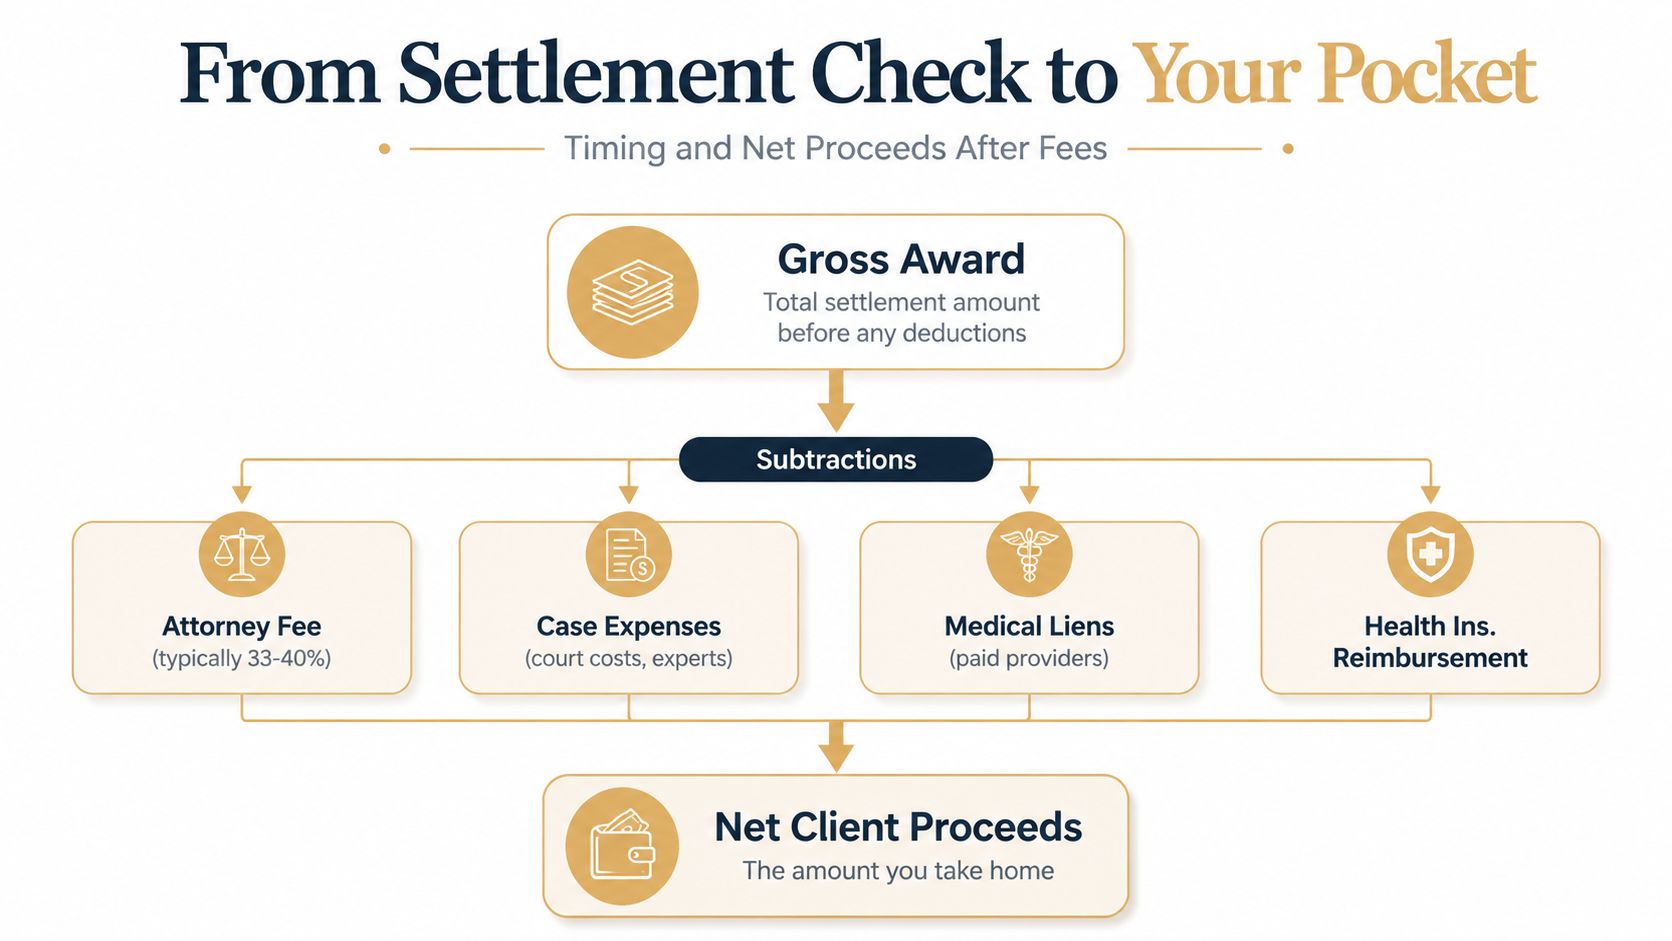
The settlement check isn't the same as claim value. Start with the gross award, then subtract the attorney fee, case expenses, medical liens, health-insurance reimbursement rights, and any outstanding treatment balances. The claimant also has to account for the time between injury, medical improvement, settlement, and distribution.
Consider a simple contingency-fee illustration. At 33⅓%, a $100,000 settlement leaves $66,667 before expenses, while a $120,000 settlement leaves $80,000 before expenses. Neither figure represents the final amount the claimant receives because both must absorb case costs and liens. The settlement payment process can help readers understand the administrative steps that occur after agreement.
Use a timeline, not only a damages total
A typical valuation timeline may include:
- Medical treatment: The claimant receives care and builds the medical record.
- Maximum medical improvement: Doctors assess whether the condition has stabilized.
- Demand preparation: Counsel assembles records, bills, wage evidence, and liability proof.
- Negotiation: The parties exchange offers and evaluate risk.
- Litigation or resolution: The case settles, proceeds through litigation, or reaches trial.
- Distribution: Fees, expenses, liens, and reimbursements are addressed before the claimant receives funds.
Straightforward claims may resolve in 1 to 6 months after maximum medical improvement, while complex matters can take 12 to 36 months or longer. Even after the parties agree, payment may take 4 to 8 weeks. The discussion of settlement timing and post-agreement payment shows why duration belongs inside the valuation model, not in a footnote.
Compare choices using realized value
An early offer may provide liquidity and reduce litigation risk. Continued negotiation may improve the gross amount, but it can also extend legal expenses and delay payment. Trial may offer a higher possible award, but the result is uncertain and distribution takes longer.
The best comparison asks three questions: What is the expected net amount? When will it arrive? What downside does the claimant accept by waiting? A gross estimate without those answers is incomplete.
Why Bigger Is Not Always Better
A larger gross result can produce less practical value if it arrives much later or carries greater risk. The comparison should account for the claimant's actual financial needs, the probability of obtaining the result, fees and expenses, liens, and the time value of money.
The requested example contrasts a $150,000 settlement paid in 8 months with a $220,000 verdict paid in 28 months. The verdict headline is $70,000 higher, but the difference can shrink after contingency fees, litigation costs, liens, delay, and the risk that the verdict is reduced, challenged, or never collected in full. The precise net result depends on the fee agreement, deductions, applicable law, coverage, and payment circumstances.
| Factor | $150k Settlement, 8 months | $220k Verdict, 28 months |
|---|---|---|
| Gross amount | $150,000 | $220,000 |
| Timing | Earlier payment | Later payment |
| Litigation exposure | Lower after agreement | Trial and post-trial exposure |
| Fees and costs | Contingency fee and expenses | Contingency fee, higher case expenses may apply |
| Liens and reimbursements | Must be resolved | Must be resolved |
| Practical valuation | More certain and available sooner | Higher headline amount, less certain and delayed |
Delay has a financial cost
Money received later can't fund current medical care, housing, debt payments, or ordinary living expenses. A claimant who waits may also face settlement fatigue, additional legal costs, and the pressure to accept unfavorable financing or medical arrangements.
Liens and reimbursement claims can further reduce the difference between two gross outcomes. Medical providers, public programs, and health plans may assert rights against settlement proceeds, and the amount owed can depend on the treatment history and applicable agreements.
Trial risk changes expected value
A verdict is an outcome, not a guarantee. The claimant must consider the possibility of losing, winning less than expected, facing comparative-fault findings, encountering evidentiary problems, or spending additional time collecting the award. Even a strong case can produce an outcome below its optimistic scenario.
Decision standard: Compare the expected net present value of each path, not the largest number printed on an offer or verdict report.
That approach doesn't mean accepting every early offer. It means assigning a value to certainty, timing, and risk alongside damages. A smaller settlement can be financially rational when it delivers reliable funds sooner, while a larger demand may be justified when the evidence, future losses, and available coverage support continued pressure.
Outh can help you organize evidence, review claim elements, and model a personal injury claim value through estimated P10, P50, and P90 outcomes rather than one headline average. Visit Outh to compare valuation assumptions, timelines, and potential net proceeds before deciding how to evaluate your next step.