 Outh
OuthLegal Analytics Platform Explained: A Practical Guide
Learn what a legal analytics platform is, how it works, and when to use one. Covers data sources, benchmarks, valuation, and real-world use cases.
Maya owns a small business that hired a vendor to build a customer portal. The vendor walked away midway through the project, leaving Maya with unpaid invoices, unusable code, and a difficult choice: pursue a contract claim or absorb the loss. She knows something went wrong, but she can't estimate her odds, likely costs, settlement value, or the time required to reach an outcome.
That decision resembles an investor studying an unfamiliar asset. Maya can see the headline, a broken contract and a financial loss, but she doesn't have a prospectus, comparable returns, or a clear risk band. A legal analytics platform supplies part of that missing decision layer by organizing court records, judge histories, attorney performance, case outcomes, and related data into usable comparisons.

By the end of this guide, you'll understand what these platforms compute, how raw legal records become estimates, why P10, P50, and P90 confidence bands matter, and where analytics can mislead you. The objective isn't to turn a legal dispute into a guaranteed forecast. It's to help you ask sharper questions before committing money, time, or trust.
Table of Contents
- When a Legal Claim Feels Like a Guess
- What a Legal Analytics Platform Is
- How the Data and Models Work Behind the Scenes
- Real Use Cases You Can Picture Yourself In
- Benefits and Limitations Worth Knowing Up Front
- Common Misconceptions That Lead People Astray
- How to Evaluate a Legal Analytics Platform
- Turning Analytics Into a Better Legal Decision
When a Legal Claim Feels Like a Guess
Maya has documents, but documents do not create a forecast. Her emails, invoices, and demand letter describe what happened, yet they leave practical questions open: How strong is the claim? What might it be worth? How long could it take? The same problem affects people comparing possible claims or choosing between attorneys. A detailed story is not the same as a useful comparison set.
A legal analytics platform places a claim beside comparable matters, much as an investor evaluates one holding within a portfolio. Depending on the product, the comparison may account for claim sub-category, jurisdiction, judge, procedural stage, opposing party, remedy, or attorney history. The result is usually a range of plausible outcomes, not one precise figure presented as certainty.
The portfolio lens
Investors examine downside exposure, a central expectation, and an upside case. Legal analytics can organize uncertainty in a similar way:
- P10 marks a lower-outcome boundary within the platform's modeled distribution.
- P50 is the middle estimate, commonly called the median.
- P90 marks a higher-outcome boundary.
These bands are not promises. They summarize how outcomes differed across comparable matters and show how much spread surrounds the estimate. A narrow band can mislead when the underlying cases are poorly matched. A wide band may be more informative when the claim sub-category, venue, evidence, or remedy produces less predictable results.
The comparison set matters as much as the percentile. A settlement benchmark for one type of injury, contract dispute, or employment claim should not automatically guide another. Likewise, an attorney's historical results may reflect a particular court or case mix rather than a general measure of skill. Analytics provides a starting frame, while a lawyer must assess facts the database may not capture.
Practical rule: Treat an analytics result as a decision aid, not as a verdict from the future.
The market has grown beyond a niche product. One independent estimate, Mordor Intelligence (2025), places the legal analytics market at USD 3.15 billion in 2025, with a projection of USD 7.52 billion by 2031 and a 15.62% CAGR from 2026 through 2031. The estimate identifies North America as the largest market and Europe as the fastest-growing region. Cloud deployment represented 68.45% of revenue in 2025, while descriptive analytics represented 52.10% of revenue share, according to Mordor Intelligence's legal analytics market estimate.
For Maya, the useful output is not a prediction that she will win. It is a clearer view of plausible paths, the assumptions behind each range, and the evidence that could change her decision about cost, timing, settlement, or representation.
What a Legal Analytics Platform Is
Suppose Maya is comparing two attorneys for a possible claim. Their websites may describe similar experience, yet the relevant questions are more specific: how comparable cases performed, how long they took, what outcomes appeared in the same venue, and how wide the range of results was. A legal analytics platform organizes evidence about those questions so a legal decision starts with an informed comparison rather than a guess.
The investing analogy clarifies the structure. A platform resembles a research terminal for legal matters. It gathers records, groups comparable cases, applies statistical or machine-learning methods, and displays patterns that can inform choices about litigation strategy, claim valuation, attorney comparison, contract risk, workload, or matter operations.
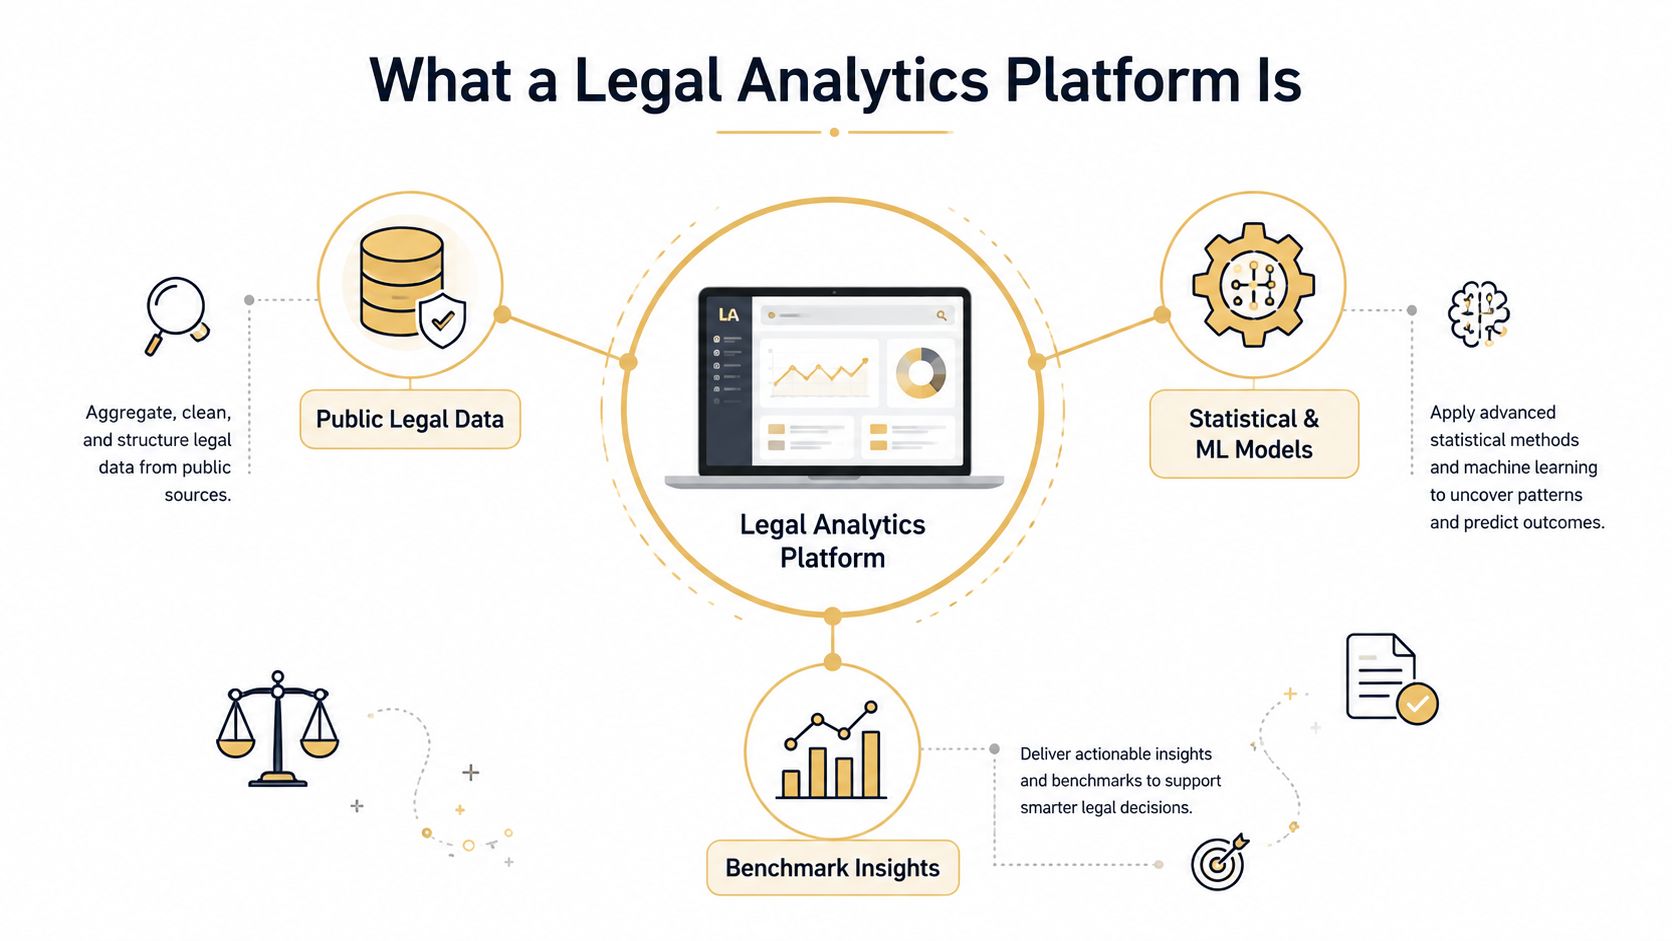
Four layers create the experience
The data layer works like a market feed. It may include court dockets, filings, opinions, judgments, settlement information, judge records, attorney information, and matter metadata. Incomplete, outdated, or incorrectly connected records can weaken every later result.
The modeling layer is the quantitative engine. It examines relationships between case characteristics and historical outcomes, then estimates measures such as outcome probabilities, settlement ranges, motion results, duration, or risk. Some products use machine-learning methods; others use statistical or econometric approaches.
The benchmark layer resembles an index built for a defined slice of the market. Instead of viewing one case in isolation, a user can compare matters within a sub-category, venue, procedural stage, judge, or opposing-party group. Percentile bands, such as P10, P50, and P90, can show a lower, middle, and higher historical range, provided the comparison set is similar.
The interface is the investor dashboard. Charts, filters, timelines, confidence bands, comparison views, and reports translate technical results into decisions a user can inspect. A model has limited value when the user cannot understand its assumptions or trace an output to the underlying records.
Legal analytics serves a different purpose from neighboring tools. E-discovery software helps locate, classify, and review documents within a matter. Case-law research retrieves authorities and legal reasoning. Analytics compares many matters to identify patterns and estimate how a new matter might develop.
For a non-lawyer, the distinction is practical. Searching for a contract-clause decision asks, “What authority discusses this issue?” Analytics asks, “How have comparable disputes tended to develop before this judge, in this venue, and within this claim category?” Readers seeking broader context on artificial intelligence in legal work can consult Outh's guide to AI for lawyers.
A platform may combine litigation analytics with operational tools, but its coverage remains product-specific. A litigation database may offer little help with contract turnaround, while a contract analytics product may provide no meaningful judge or motion benchmarks.
How the Data and Models Work Behind the Scenes
The number on a dashboard begins as messy legal material. A platform has to turn filings, docket events, outcomes, and matter descriptions into consistent fields before a model can make a useful comparison.
From records to structured inputs
First, ingestion brings the records together. Depending on the platform, inputs may include federal and state dockets, court opinions, filings, attorney and judge information, settlement filings, and matter metadata. Coverage isn't uniform. State trial courts and smaller federal matters can be less consistently documented, which means a polished interface may conceal gaps in the underlying corpus.
Second, normalization creates a common vocabulary. Courts and lawyers don't always describe the same dispute in the same way. One record may call a matter a breach of contract claim, while another uses a more specific commercial label. Normalization maps inconsistent descriptions into a shared taxonomy so the platform can compare matters that are substantively similar.
This is also where entity resolution matters. A judge, attorney, or firm may appear under different spellings or names across records. Missing fields, fragmented dockets, and inconsistent terminology can distort search and benchmarking. Legal-tech commentary on the perils and promises of legal analytics highlights these data-quality and standardization problems, including incomplete court data and changing attorney or firm names.
Third, modeling converts features into estimates. A model may examine jurisdiction, case type, eligibility factors, documentation status, disposition history, venue patterns, judge behavior, and fact-pattern similarity. Depending on the product, it might estimate time to resolution, a settlement range, the probability of a motion outcome, or a risk score. The technical descriptions of legal predictive analytics describe this use of historical outcomes, venue patterns, judge behavior, and similar fact patterns.
Fourth, benchmarking places the matter in context. The platform may compare a case with matters before the same judge, in the same jurisdiction, within the same sub-category, or involving a similar counterparty. The narrower and more relevant the comparison set, the more informative the result can be, assuming the dataset is large and reliable enough.
Most responsible systems should communicate uncertainty through a distribution or confidence band rather than a single point estimate. P10, P50, and P90 can help a reader distinguish a lower scenario, central scenario, and higher scenario. They don't eliminate uncertainty, especially when the platform has limited comparable data.
| Stage | What Happens | Main Risk or Bias |
|---|---|---|
| Data ingestion | The platform gathers dockets, filings, opinions, outcomes, and matter details. | Missing jurisdictions or delayed updates can make the dataset incomplete. |
| Normalization | Records receive consistent case, party, attorney, judge, and outcome labels. | Inconsistent terminology, duplicate entities, and missing fields can create false comparisons. |
| Modeling | Statistical or machine-learning methods estimate outcomes, ranges, risks, or duration. | Historical patterns may not reflect the facts, law, or strategy in a new matter. |
| Benchmarking | The user's claim is compared with selected similar matters. | Broad categories can hide important differences between sub-categories. |
| Presentation | Results appear as dashboards, ranges, charts, and reports. | Clear visuals can make uncertain estimates look more precise than they are. |
Two platforms can disagree about the same case without either one being obviously defective. Vendors may use different data sources, weighting methods, taxonomies, exclusion rules, or undisclosed training data. A settlement-value tool such as a settlement value calculator should therefore be treated as one analytical input, not a universal pricing authority.
Real Use Cases You Can Picture Yourself In
The mechanics become clearer when attached to decisions people face.
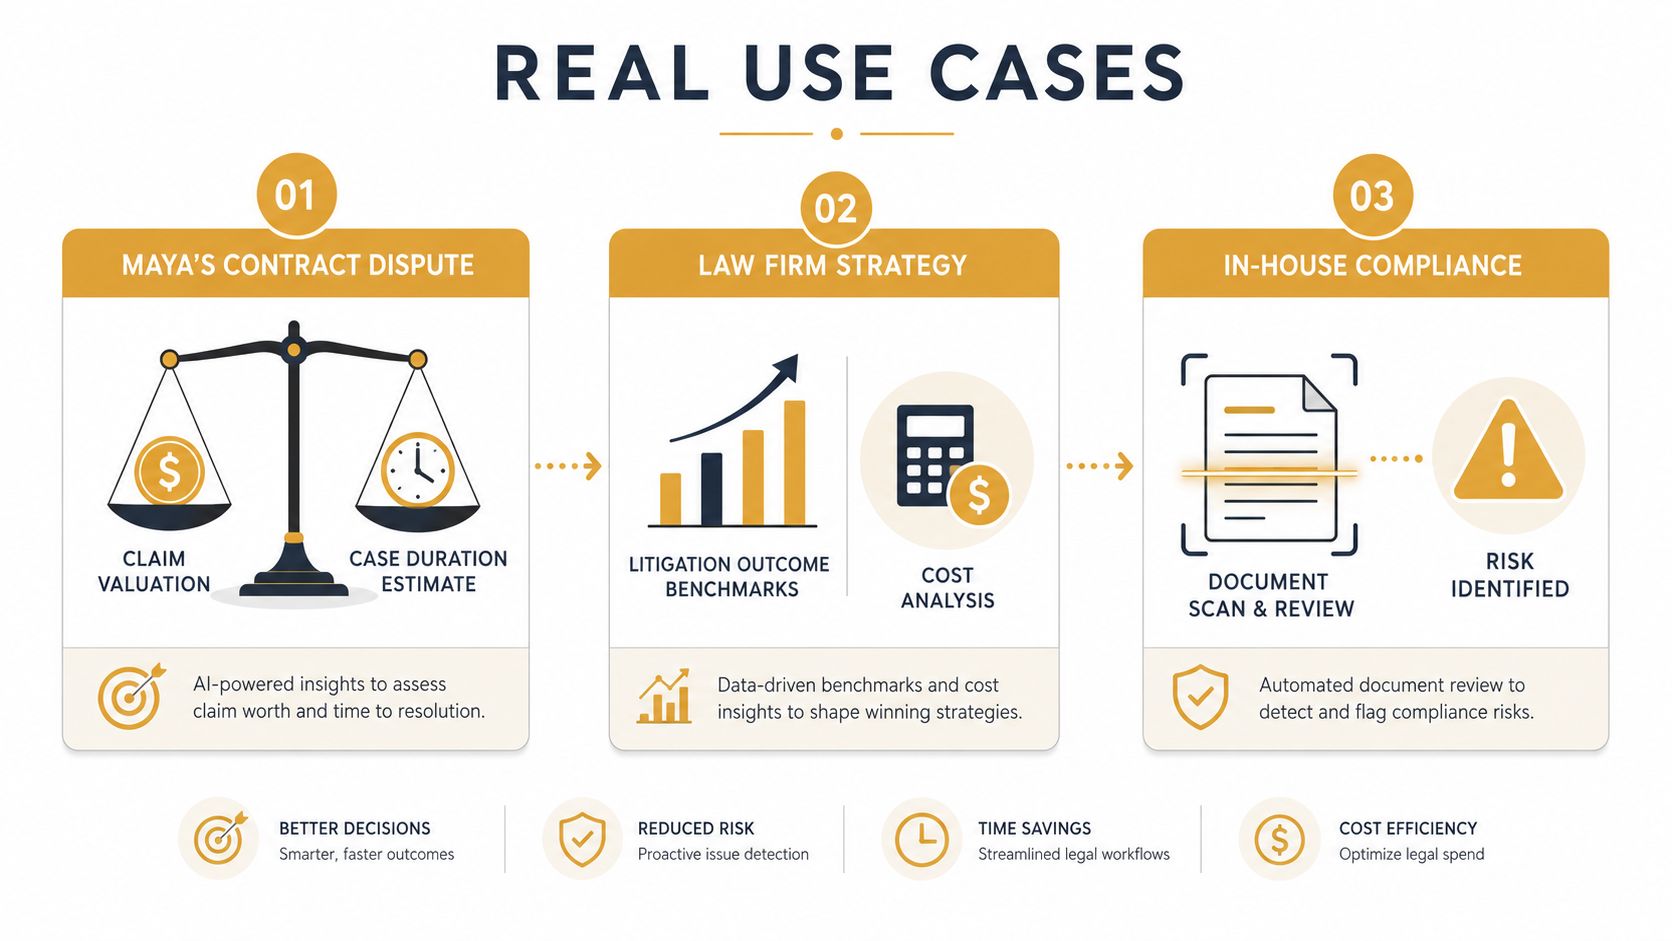
Maya begins with the contract dispute. She enters the claim category, jurisdiction, approximate damages, procedural posture, available documentation, and other facts the platform requests. The system compares those inputs with similar matters and displays a lower scenario, a median scenario, and a higher scenario, alongside an estimated duration for comparable cases.
The result doesn't tell Maya whether to sue. It can help her frame the decision. If the lower scenario barely covers likely costs, she may prioritize a negotiated resolution. If the central estimate changes after she adds proof of payment or a clear termination clause, that change tells her which evidence is carrying analytical weight. A range is more useful than a headline because it shows both potential value and exposure to disappointment.
Daniel studies the elements of a defense
Daniel is in-house counsel defending a product-liability claim. Rather than viewing the dispute only as a pile of documents, he uses an element-tracking view to organize the required components of the claim and compare how similar matters have performed at an early procedural stage.
The output might show that one element frequently survives an early challenge, while another often becomes decisive. Daniel still needs to examine the pleadings, evidence, jurisdiction, and applicable law. The benchmark helps him decide where to direct investigation and which weaknesses deserve attention first.
Priya compares representation options
Priya is considering a wrongful-termination claim. She wants a lawyer with experience in the relevant claim category, but a general reputation isn't enough. An analytics platform can help her compare attorneys using available historical performance indicators, sub-category experience, opposing-counsel context, jurisdiction, and fee information.
A high historical win rate doesn't automatically make one lawyer the right choice. Priya should ask whether the attorney handled comparable matters, whether the reported outcomes are defined consistently, and whether the fee arrangement fits her finances. Analytics narrows the search. It doesn't conduct the interview or evaluate professional judgment.
The same portfolio logic can help someone tracking several potential matters. A person may compare an employment claim, an injury claim, and a civil-rights issue without pretending they're interchangeable. Each matter can retain its own assumptions, evidence checklist, range, and timeline.
A plain-language explanation of claim value can be useful before speaking with counsel. For a related perspective, review how much a lawsuit may be worth.
The central benefit is not a magic answer. It is a clearer record of what the user knows, what the platform assumes, and which decision each estimate is supposed to support.
Benefits and Limitations Worth Knowing Up Front
Legal analytics earns its place when it improves a real decision. It can orient a person entering an unfamiliar practice area, give negotiation discussions a historical baseline, help compare attorneys, and show risk across multiple matters. It can also organize information that would otherwise remain scattered across dockets, correspondence, spreadsheets, and personal notes.
Those benefits have boundaries. Court records can arrive after events occur, state-court coverage may be uneven, and vendor taxonomies may combine claims that look similar but behave differently. A platform may also present a result without fully explaining how it weighted sub-categories or handled missing information.
| Dimension | Strengths | Watch Out For |
|---|---|---|
| Orientation | Helps users understand unfamiliar claim types, venues, and procedural patterns. | A broad category may not match the facts or legal theory in the user's matter. |
| Negotiation | Provides a historical baseline for discussing value and timing. | Historical settlements may reflect different evidence, parties, counsel, or incentives. |
| Attorney comparison | Supports more focused shortlists using relevant experience and performance indicators. | Results may contain selection bias, inconsistent outcome definitions, or incomplete records. |
| Portfolio visibility | Lets users compare assumptions and ranges across multiple potential claims. | Different claim categories shouldn't be ranked as if they were identical assets. |
| Data quality | Normalized records can reveal patterns that manual review misses. | Missing fields, name changes, duplicates, and inconsistent labels can weaken comparisons. |
| Accessibility | Dashboards can make complicated records easier to interpret. | Licensing and fee structures may make access less practical for individuals than institutions. |
| Predictive output | Confidence bands communicate a range instead of false certainty. | A range can still be misleading if the comparison set is sparse or poorly matched. |
Why data quality changes the answer
A platform's estimate is only as credible as the records supporting it. If settlement amounts are missing, case outcomes are coded inconsistently, or a party is split across duplicate entries, the model may calculate a neat result from unreliable inputs. Litigation analytics implementation guidance emphasizes normalization and quality control for filings, outcomes, and matter metadata because forecasts depend on reliable feature sets.
Cloud delivery can make updates and access easier, but cloud access isn't the same as data quality. One industry commentary estimate places cloud-based legal analytics deployments at 68.97%, a figure discussed in Trellis's analysis of analytics risks and promises. The practical question is whether the vendor explains refresh timing, source coverage, corrections, and uncertainty.
A separate adoption challenge is proving operational value. A 2026 survey found that 83% of legal teams struggle to show the value of AI, according to Axiom's legal AI gap resource. That finding reinforces an important test: don't ask only whether a platform has impressive features. Ask which decision, delay, or cost it will help you measure.
Common Misconceptions That Lead People Astray
Myth one, a platform can predict your exact outcome. Two people may bring similar contract claims, but one has a contemporaneous admission while the other has ambiguous emails. A historical model may classify them together even though that single fact changes settlement dynamics. Read the range and inspect the inputs instead of treating the output as a promise.
Myth two, analytics replaces a lawyer. A P50 estimate can't decide whether a document is authentic, whether a witness is credible, or whether a legal theory fits the governing law. A lawyer interprets the estimate alongside evidence, procedure, privilege, strategy, and negotiation dynamics. Use analytics to prepare better questions for counsel.
Myth three, every case type has equal coverage. A well-documented patent docket may provide rich structured records, while a state landlord-tenant matter may have sparse or inconsistent information. Ask the vendor to identify the source coverage for your specific jurisdiction and claim category.
Myth four, the attorney with the highest win rate is always the best choice. Attorneys may select different cases, represent different clients, or accept matters with different levels of difficulty. A strong record in one venue or sub-category may not transfer to yours. Compare relevant experience, outcome definitions, strategy, communication, and fees.
Myth five, more data automatically means more certainty. A large database can still contain duplicated parties, missing outcomes, and mismatched claim labels. Conversely, a small but carefully defined comparison set may reveal that uncertainty is high. Wide bands can be a sign of honest modeling, not poor software.
The better habit is to ask what the platform knows, what it doesn't know, and what new fact would materially change the result.
How to Evaluate a Legal Analytics Platform
Start with the question the platform must answer. “I want legal AI” is too broad. “I need to compare settlement ranges for employment claims in my state” gives a vendor something testable.
Ask about the evidence first
Request a plain-language description of the jurisdictions, courts, practice areas, and claim sub-categories covered. Ask how recent the records are, how the vendor handles delayed filings, and whether users can see source records behind a benchmark. A useful answer names coverage boundaries and known gaps. "Our database is extensive" doesn't.
Then test benchmark relevance. Does the platform separate case type, venue, judge, procedural stage, and opposing party where those distinctions matter? A broad average may look stable while hiding materially different outcomes across sub-categories.
Inspect the model's uncertainty
Look for P10, P50, and P90 bands or another clear expression of uncertainty. Ask what each band means, how sample size affects the display, and when the system declines to produce an estimate. A trustworthy vendor should show a sample report and walk through a query using a matter similar to yours.
Data controls deserve direct questions:
- Normalization: How are inconsistent case labels mapped into shared categories?
- Entity resolution: How does the platform identify the same attorney, judge, or firm across name variations?
- Corrections: Can users report errors, and how does the vendor update affected records?
- Sparse data: What happens when a claim type has few comparable matters?
- Export rights: Can you download reports, assumptions, and matter data if you leave?
Pricing should be equally specific. Ask about individual access, institutional licensing, implementation, report limits, data exports, and cancellation terms. A low introductory price may not describe the full cost of using the platform for a real matter.
Finally, run the same anonymized query through more than one platform when possible. Differences can reveal how each vendor defines the category, weights the records, or communicates uncertainty. The goal isn't to find the most optimistic answer. It's to identify the estimate whose assumptions you can understand and challenge.
Turning Analytics Into a Better Legal Decision
The portfolio lens works because it changes the question. Instead of asking, “What will happen to my case?” ask, “What range of outcomes appears plausible, what assumptions create that range, and what decision follows from each scenario?”
Read the confidence band, not just the central estimate. A P50 outcome can help organize expectations, but P10 may matter more when you can't tolerate downside. P90 may matter when deciding whether additional evidence or legal expense is justified.
Use the output beside professional judgment. Counsel can test whether the selected comparisons fit the facts, whether the model overlooks a controlling legal issue, and whether a procedural choice could move the matter outside the historical pattern. Analytics should sharpen that conversation, not end it.
Revisit the estimate when the facts change. A new document, amended pleading, court ruling, medical development, or settlement offer can alter the relevant comparison set. Probabilistic forecasts should move when their inputs move.
Before speaking with a vendor, write down the exact question you want answered. Request a sample report for your claim type, compare the same query across platforms, and record the assumptions behind each result. That process will tell you more than a feature list.
Outh helps individuals identify, organize, and evaluate potential civil claims through AI-assisted discovery, claim valuation, evidence management, plain-language email interpretation, benchmarking, and attorney matching. Visit Outh to compare your legal questions with a portfolio-style view of possible value, timing, and next steps.